Instructions
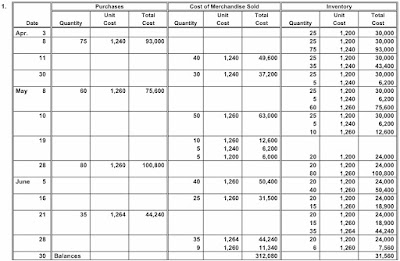
1. Record the inventory, purchases, and cost of merchandise sold data in a perpetual inventory record similar to the one illustrated in Exhibit 4, using the last-in, first-out method.
2. Determine the total sales, the total cost of merchandise sold, and the gross profit from sales for the period.
3. Determine the ending inventory cost on June 30.
Answer:
1.
Unit Total Unit Total Unit Total
Quantity Cost Cost Quantity Cost Cost Quantity Cost Cost
Apr. 325 1,200 30,000
8 75 1,240 93,00025 1,200 30,000
75 1,240 93,000
1140 1,240 49,600 25 1,200 30,000
35 1,240 43,400
3030 1,240 37,200 25 1,200 30,000
5 1,240 6,200
May 8 60 1,260 75,60025 1,200 30,000
5 1,240 6,200
60 1,260 75,600
1050 1,260 63,000 25 1,200 30,000
5 1,240 6,200
10 1,260 12,600
1910 1,260 12,600
5 1,240 6,200
5 1,200 6,000 20 1,200 24,000
28 80 1,260 100,80020 1,200 24,000
80 1,260 100,800
June 540 1,260 50,400 20 1,200 24,000
40 1,260 50,400
1625 1,260 31,500 20 1,200 24,000
15 1,260 18,900
21 35 1,264 44,24020 1,200 24,000
15 1,260 18,900
35 1,264 44,240
2835 1,264 44,240 20 1,200 24,000
9 1,260 11,340 6 1,260 7,560
30 Balances312,08031,560
2. Total sales.................................................................................... $525,250
Total cost of merchandise sold......................................................... 312,080
Gross profit.................................................................................... $213,170
*$525,250 = $80,000 + $60,000 + $100,000 + $40,000 + $90,000 + $56,250 + $99,000
3. $31,560 = [(20 units × $1,200) + (6 units × $1,260)]
= $24,000 + $7,560


