Showing posts with label Dunne Co. Show all posts

Tuesday, April 30, 2019

The beginning inventory for Dunne Co. and data on purchases and sales for a three-month period are shown in Problem 7-1B

The beginning inventory for Dunne Co. and data on purchases and sales for a three-month period are shown in Problem 7-1B.

Instructions
1. Determine the inventory on June 30 and the cost of merchandise sold for the three-month period, using the first-in, first-out method and the periodic inventory system.
2. Determine the inventory on June 30 and the cost of merchandise sold for the three-month period, using the last-in, first-out method and the periodic inventory system.
3. Determine the inventory on June 30 and the cost of merchandise sold for the three-month period, using the weighted average cost method and the periodic inventory system.  Round the weighted average unit cost to the dollar.
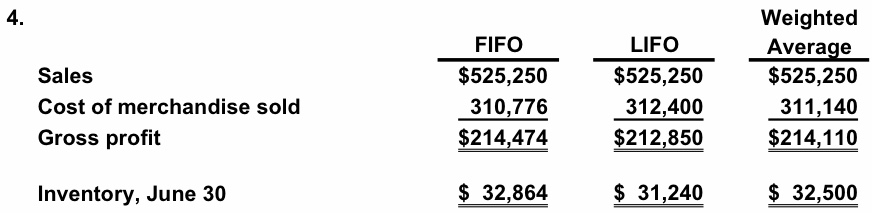
4. Compare the gross profit and June 30 inventories using the following column headings:

FIFO LIFO Weighted Average Sales Cost of merchandise sold Gross profit Inventory, June 30


Answer:


1. First-In, First-Out Method
Merchandise inventory, June 30................................................. $ 32,864
Cost of merchandise sold........................................................... 310,776
Supporting computations
Merchandise inventory:
26 units @ $1,264............................................................... $ 32,864
Cost of merchandise sold:
Beginning inventory, April 1....................................................... $ 30,000
Purchases............................................................................... 313,640
Merchandise available for sale.................................................... $343,640
Less ending inventory, June 30................................................... 32,864
Cost of merchandise sold......................................................... $310,776
2. Last-In, First-Out Method
Merchandise inventory, June 30................................................ $ 31,240
Cost of merchandise sold.......................................................... 312,400
Supporting computations
Merchandise inventory:
25 units @ $1,200............................................................... $30,000
1 unit @ $1,240............................................................... 1,240
26 units........................................................................... $31,240
Cost of merchandise sold:
Beginning inventory, April 1...................................................... $ 30,000
Purchases................................................................................. 313,640
Merchandise available for sale................................................... $343,640
Less ending inventory, June 30................................................. 31,240
Cost of merchandise sold.........................................................
3. Weighted Average Cost Method
Merchandise inventory, June 30.................................... $ 32,500
Cost of merchandise sold............................................. 311,140
Supporting computations
$343,640
275 units
Merchandise inventory:
26 units × $1,250 = $32,500
Cost of merchandise sold:
Beginning inventory, April 1....................................... $ 30,000
Purchases.................................................................. 313,640
Merchandise available for sale.................................... $343,640
Less ending inventory, June 30.................................... 32,500
Cost of merchandise sold............................................. $311,140
$312,400
4.Weighted
FIFO LIFO Average
Sales$525,250 $525,250 $525,250
Cost of merchandise sold 310,776 312,400 311,140
Gross profit $214,474 $212,850 $214,110

Inventory, June 30 $ 32,864 $ 31,240 $ 32,500

The beginning inventory for Dunne Co. and data on purchases and sales for a three-month period are shown in Problem 7-1B.

The beginning inventory for Dunne Co. and data on purchases and sales for a three-month period are shown in Problem 7-1B.

Instructions
1. Record the inventory, purchases, and cost of merchandise sold data in a perpetual inventory record similar to the one illustrated in Exhibit 5, using the weighted average cost method.
2. Determine the total sales, the total cost of merchandise sold, and the gross profit from sales for the period.
3. Determine the ending inventory cost on June 30.


Answer:

1.
Unit Total Total Total
Quantity Cost Cost Quantity Unit Cost Cost Quantity Unit Cost Cost
 Apr. 325 1,200 30,000
8 75 1,240 93,000100 1,230 123,000
1140 1,230 49,200 60 1,230 73,800
3030 1,230 36,900 30 1,230 36,900
 May 8 60 1,260 75,60090 1,250 112,500
1050 1,250 62,500 40 1,250 50,000
1920 1,250 25,000 20 1,250 25,000
28 80 1,260 100,800100 1,258 125,800
 June 540 1,258 50,320 60 1,258 75,480
1625 1,258 31,450 35 1,258 44,030
21 35 1,264 44,24070 1,261 88,270
2844 1,261 55,484 26 1,261 32,786
30  Balances310,854 32,786
2. Total sales…………………………………………………………… $525,250
Total cost of merchandise sold………………………………… 310,854
Gross profit…………………………………………………………… $214,396
*$525,250 = $80,000 + $60,000 + $100,000 + $40,000 + $90,000 + $56,250 + $99,000
3. $32,786 (26 units × $1,261)


The beginning inventory for Dunne Co. and data on purchases and sales for a three-month period are shown in Problem 7-1B.

The beginning inventory for Dunne Co. and data on purchases and sales for a three-month period are shown in Problem 7-1B.

Instructions
1. Record the inventory, purchases, and cost of merchandise sold data in a perpetual inventory record similar to the one illustrated in Exhibit 4, using the last-in, first-out method.
2. Determine the total sales, the total cost of merchandise sold, and the gross profit from sales for the period.
3. Determine the ending inventory cost on June 30.


Answer:


1.
Unit Total Unit Total Unit Total
Quantity Cost Cost Quantity Cost Cost Quantity Cost Cost
 Apr. 325 1,200 30,000
8 75 1,240 93,00025 1,200 30,000
75 1,240 93,000
1140 1,240 49,600 25 1,200 30,000
35 1,240 43,400
3030 1,240 37,200 25 1,200 30,000
5 1,240 6,200
 May 8 60 1,260 75,60025 1,200 30,000
5 1,240 6,200
60 1,260 75,600
1050 1,260 63,000 25 1,200 30,000
5 1,240 6,200
10 1,260 12,600
1910 1,260 12,600
5 1,240 6,200
5 1,200 6,000 20 1,200 24,000
28 80 1,260 100,80020 1,200 24,000
80 1,260 100,800
 June 540 1,260 50,400 20 1,200 24,000
40 1,260 50,400
1625 1,260 31,500 20 1,200 24,000
15 1,260 18,900
21 35 1,264 44,24020 1,200 24,000
15 1,260 18,900
35 1,264 44,240
2835 1,264 44,240 20 1,200 24,000
9 1,260 11,340 6 1,260 7,560
30  Balances312,08031,560
2. Total sales.................................................................................... $525,250
Total cost of merchandise sold......................................................... 312,080
Gross profit.................................................................................... $213,170
*$525,250 = $80,000 + $60,000 + $100,000 + $40,000 + $90,000 + $56,250 + $99,000
3. $31,560 = [(20 units × $1,200) + (6 units × $1,260)]
= $24,000 + $7,560

The beginning inventory of merchandise at Dunne Co. and data on purchases and sales for a three-month period ending June 30 are as follows:

The beginning inventory of merchandise at Dunne Co. and data on purchases and sales for a three-month period ending June 30 are as follows:

Date Transaction Number of Units Per   Unit Total Apr. 3 Inventory 25 $1,200 $ 30,000 8 Purchase 75 1,240 93,000 11 Sale 40 2,000 80,000 30 Sale 30 2,000 60,000 May 8 Purchase 60 1,260 75,600  10 Sale 50 2,000 100,000 19 Sale 20 2,000 40,000 28 Purchase 80 1,260 100,800 June 5 Sale 40 2,250 90,000  16 Sale 25 2,250 56,250 21 Purchase 35 1,264 44,240 28 Sale 44 2,250 99,000


Instructions
1. Record the inventory, purchases, and cost of merchandise sold data in a perpetual inventory record similar to the one illustrated in Exhibit 3, using the first-in, first-out method.
2. Determine the total sales and the total cost of merchandise sold for the period. Journalize the entries in the sales and cost of merchandise sold accounts. Assume that all sales were on account.
3. Determine the gross profit from sales for the period.
4. Determine the ending inventory cost on June 30.
5. Based upon the preceding data, would you expect the inventory using the last-in, first-out method to be higher or lower?


Answer:

1.
Unit Total Unit Total Unit Total
Quantity Cost Cost Quantity Cost Cost Quantity Cost Cost
 Apr. 325 1,200 30,000
8 75 1,240 93,00025 1,200 30,000
75 1,240 93,000
1125 1,200 30,000
15 1,240 18,600 60 1,240 74,400
3030 1,240 37,200 30 1,240 37,200
 May 8 60 1,260 75,60030 1,240 37,200
60 1,260 75,600
1030 1,240 37,200
20 1,260 25,200 40 1,260 50,400
1920 1,260 25,200 20 1,260 25,200
28 80 1,260 100,80020 1,260 25,200
80 1,260 100,800
 June 520 1,260 25,200
20 1,260 25,200 60 1,260 75,600
1625 1,260 31,500 35 1,260 44,100
21 35 1,264 44,24035 1,260 44,100
35 1,264 44,240
2835 1,260 44,100
9 1,264 11,376 26 1,264 32,864
30  Balances310,77632,864
2. Accounts Receivable525,250
Sales525,250
Cost of Merchandise Sold310,776
Merchandise Inventory310,776
*$525,250 = $80,000 + $60,000 + $100,000 + $40,000 + $90,000 + $56,250 + $99,000
3. $214,474 ($525,250 – $310,776)
4. $32,864 (26 units × $1,264)
5. Because the prices rose from $1,200 for the April 3 inventory to $1,264 for the 
purchase on June 21, we would expect that under last-in, first-out, the inventory 

would be lower.